basilh@virginia.edu
@basilhalperin
Joint with Trevor Chow and J. Zachary Mazlish
Note: This is an appendix to “AGI and the EMH: markets are not expecting aligned or unaligned AI in the next 30 years”.
Throughout the body of the main post, we are badly violating Tyler Cowen’s Third Law: “all propositions about real interest rates are wrong”.
The origin of this (self-referential) idea is that there are many conflicting claims about real interest rates. One way to see this point is this thread from Jo Michell listing seventy different theories for the determination of real and nominal interest rates.
We do think Tyler’s Third Law is right – economists do not have a sufficiently good understanding of real interest rates – and we speculate that there are three reasons for this poor understanding.
1. Real vs. nominal interest rates. A basic problem is that many casual observers simply conflate nominal interest rates and real interest rates, failing to distinguish them. This muddies many discussions about “interest rates”, since nominal and real rates are driven by different factors.
2. Adjusting for inflation and default risk. Another extremely important part of the problem, discussed at length in section IV of the main post, is that there did not exist a market-based measure of risk-free, real interest rates until the last 2-3 decades, with the advent of inflation-linked bonds and inflation swaps.
Most analyses instead use nominal rates – where in contrast there are centuries of data – and try to construct a measure of expected inflation in order to estimate real interest rates via the Fisher equation (e.g. Lunsford and West 2019). Crucially, the crude attempts to measure expected inflation create extensive distortions in these analyses.
Even more problematically, much of the historical data on nominal interest rates comes from bonds that were not just nominal but also were risky (e.g. Schmelzing 2020): historical sovereigns had high risk of default. Adjusting for default risk is extremely difficult, just like adjusting for inflation expectations, and also creates severe distortions in analyses.
3. Drivers of short-term real rates are different from those for long-term rates. Finally, another important issue in discourse around real interest rates is that the time horizon really matters.
In particular: our best understanding of the macroeconomy predicts that real rates should have very different drivers in the short run versus in the long run.This short run versus long run distinction is blurry and vague, so it is difficult to separate the data to do the two relevant analyses of “what drives short-term real rates” versus “what drives long-term real rates”. Much analysis simply ignores the distinction.
---
Together, one or more of these three issues – the nominal-real distinction; the lack of historical risk-free inflation-linked bonds; and the short- vs. long-run distinction – tangles up most research and popular discourse on real interest rates.
Hence, Tyler’s Third Law: “all propositions about real interest rates are wrong”.
In the main post, we hope that by our use of data from inflation-linked bonds – rather than shoddily constructing pseudo data on inflation expectations, to use with nominal bond data – and being careful to work exclusively with long-run real rates, we have avoided the Third Law.
---
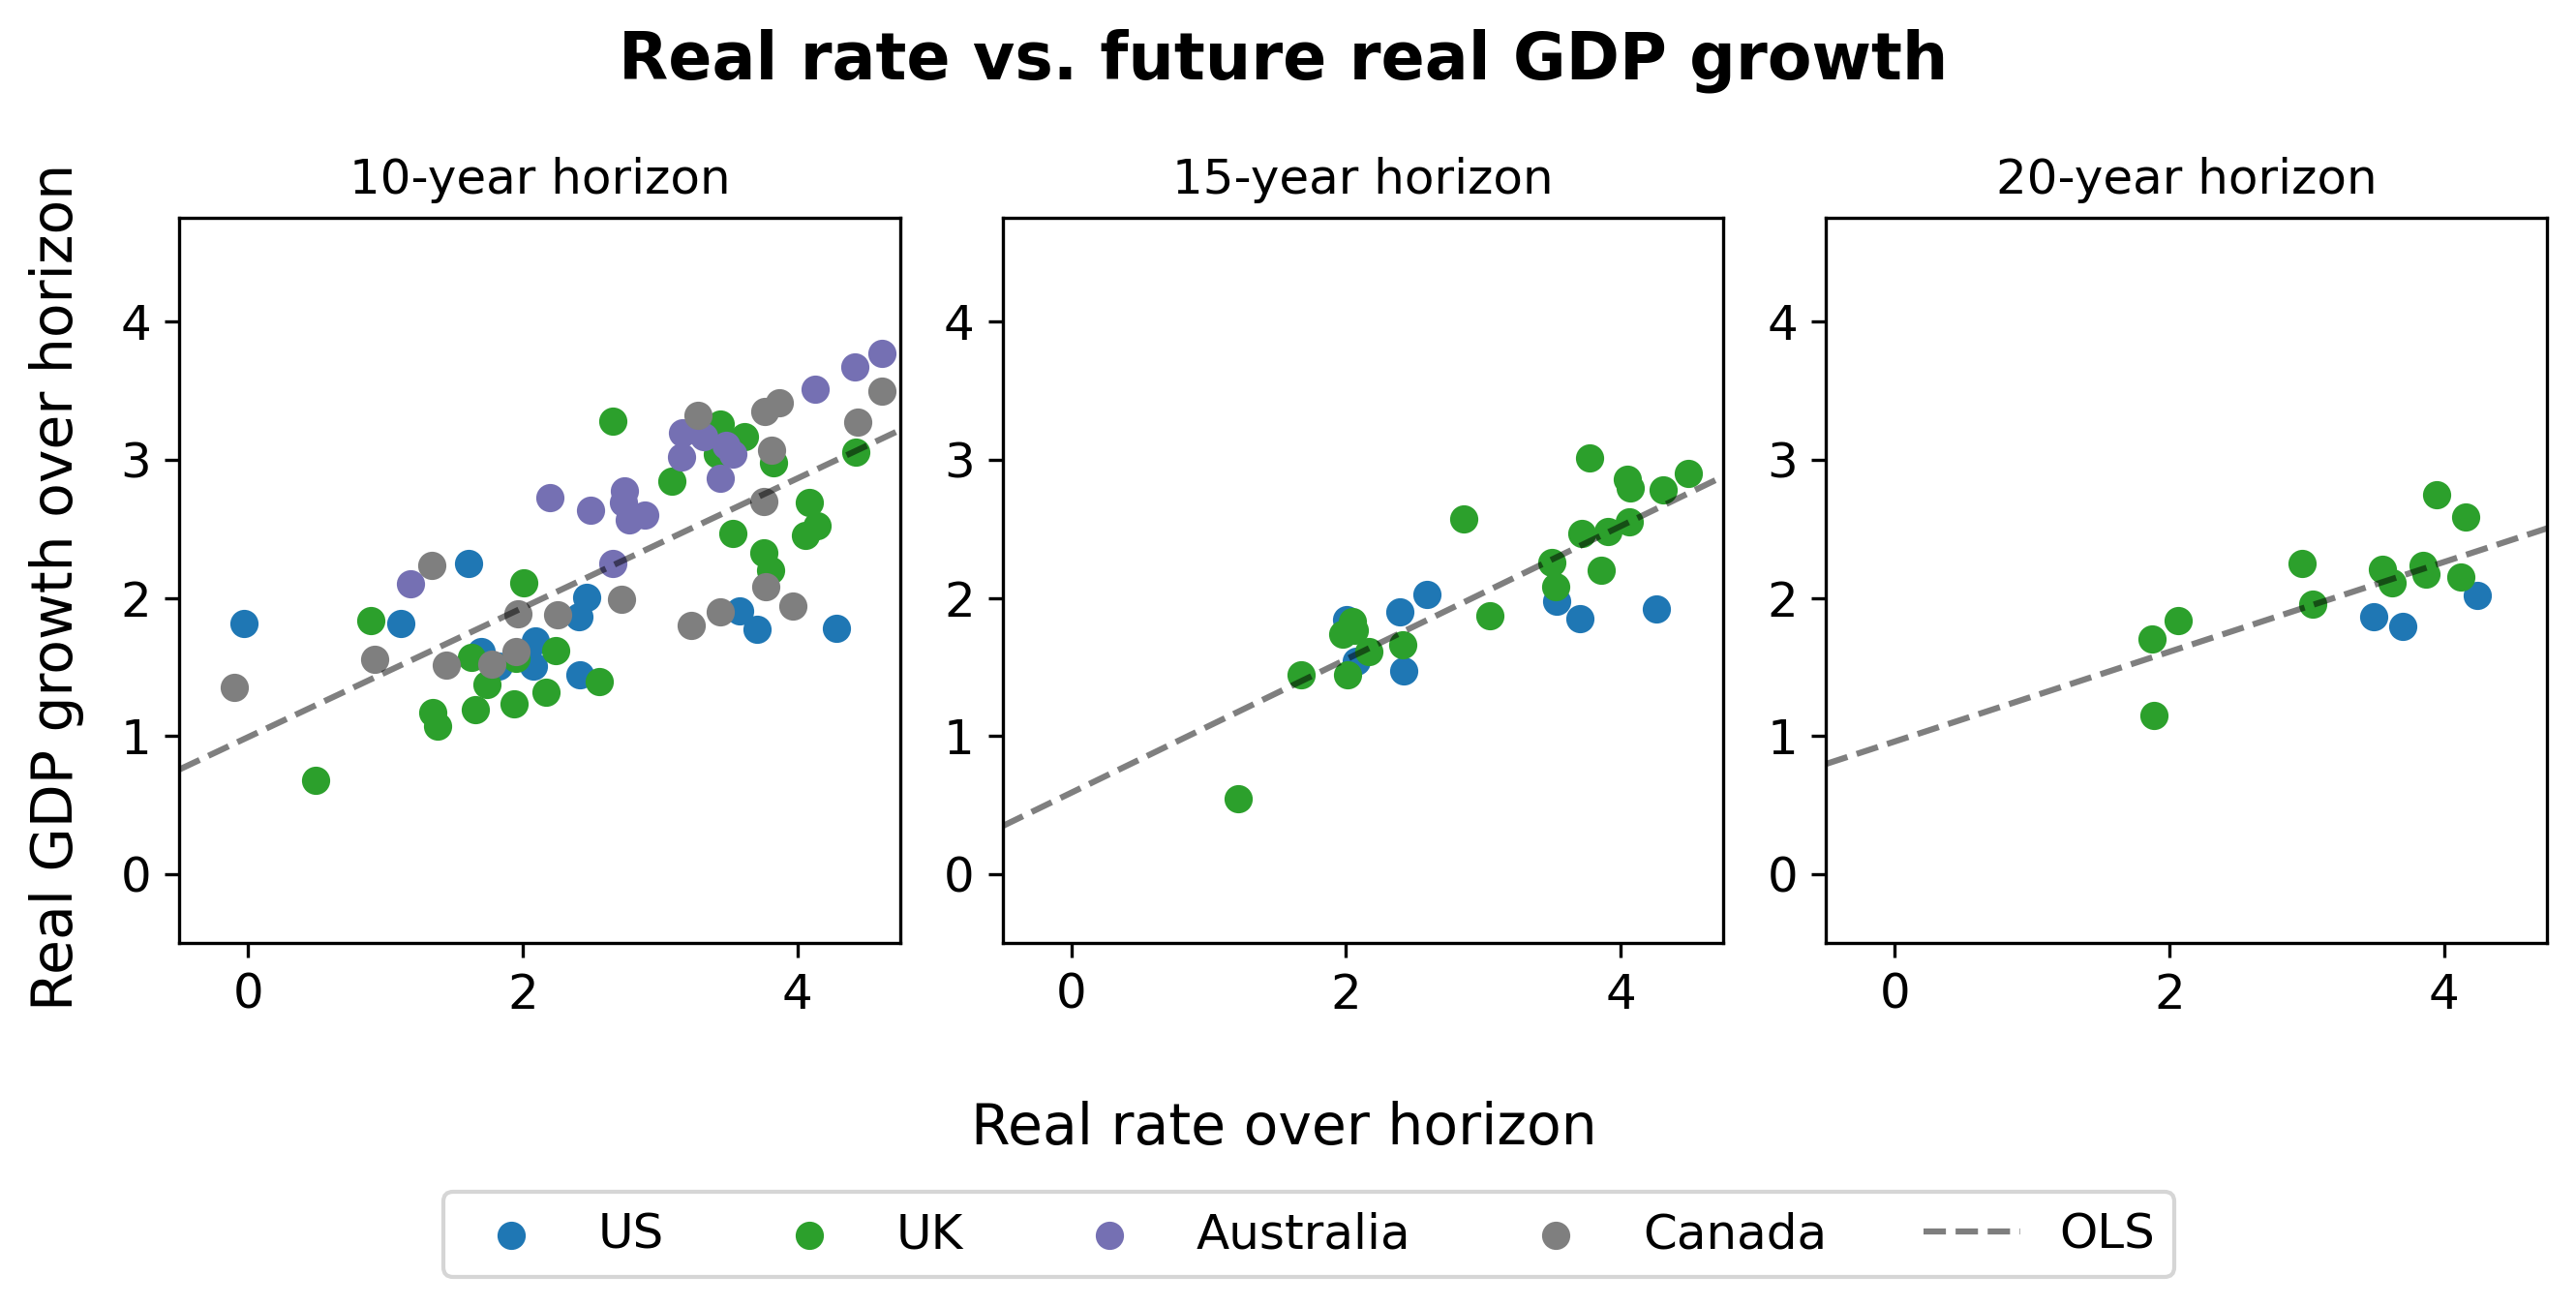
The above figure is from the main post. To see how to read these graphs, take for example the left-most graph (“10-year horizon”) and pick a green dot. The x-axis then shows the level of the real interest rate in the UK, as reflected on 10-year inflation linked bonds, in some given year. The y-axis shows average real GDP growth over the following 10 years from that point. For data discussion and important statistical notes, see the main post.